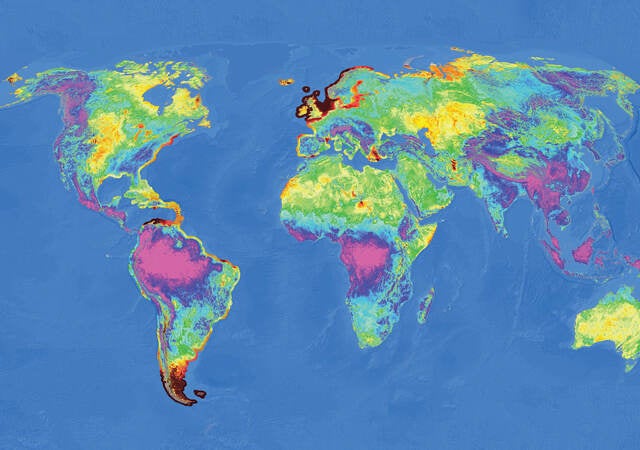
Make confident wind development decisions with high-resolution data
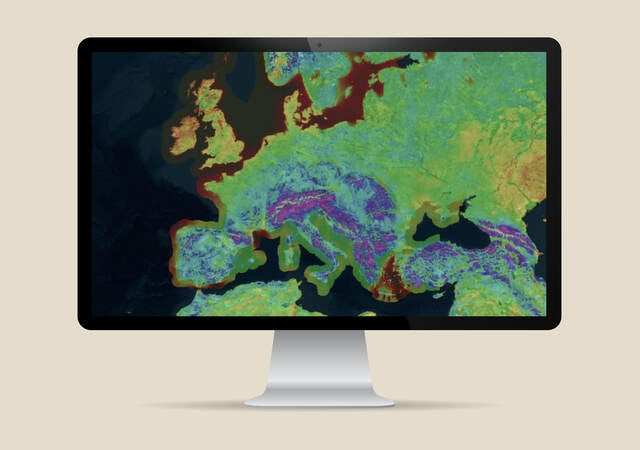
Make informed decisions with high-resolution wind resource data in an intuitive, powerful platform. ULTRUS™ Windnavigator can help you accelerate your project feasibility assessments with easy access to high-quality, global datasets — so you can move forward with confidence.

Fast, data-driven decisions for project success
Make informed decisions while reducing overhead expenses and risks of manual surveying.
Help mitigate site feasibility risk
Gain the detail you need to select sites with the strongest and most reliable wind potential.
Opportunities for faster project funding
Leverage high-value data and intuitive reporting capabilities to clearly and confidently showcase value to your stakeholders.
Wind Resource Grids (WRG) for smarter site selection
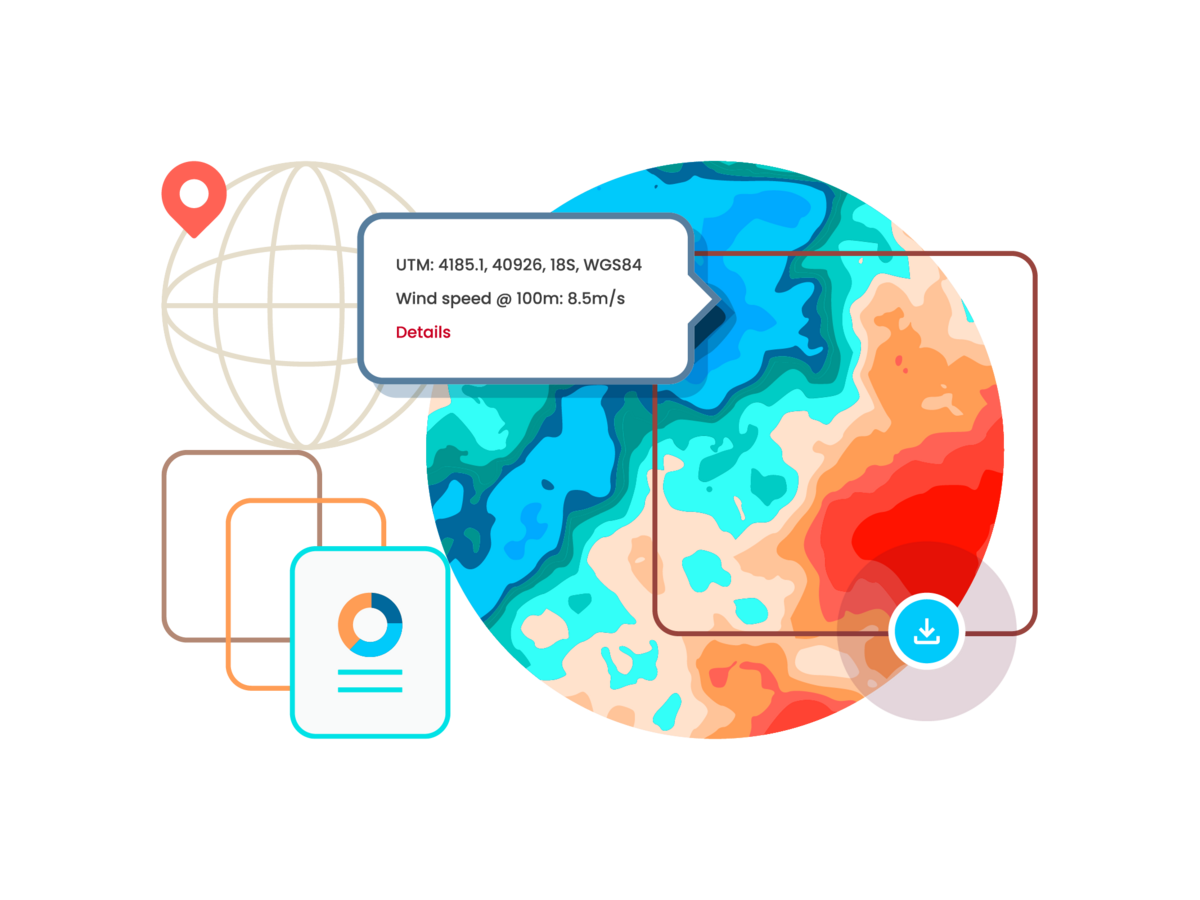
Granular wind resource data at 200 m resolution for feasibility studies and preliminary energy yield assessments.
Formats available: GeoTIFF, shapefile, CSV
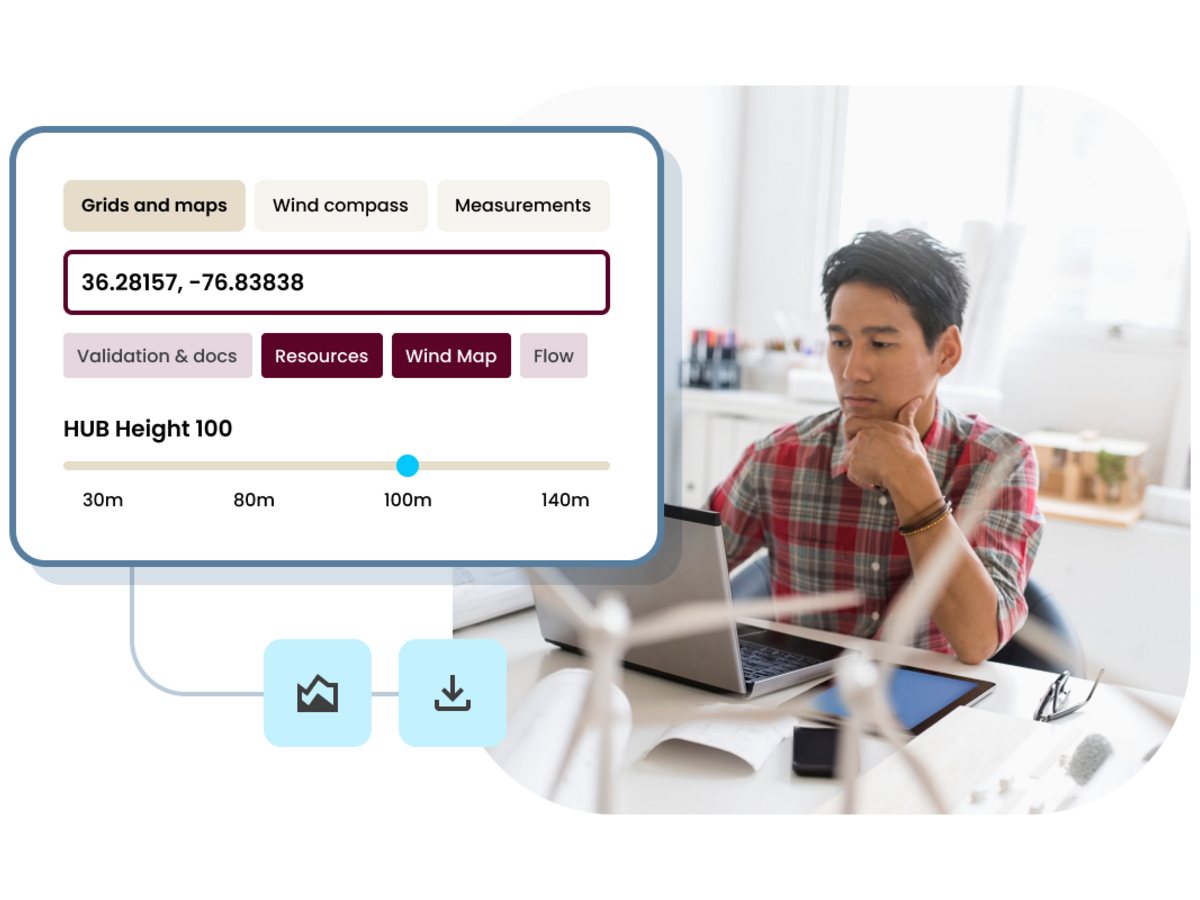
Annual average wind speed at hub heights from 10 to 140 m
Provides precise wind speed estimates for different turbine configurations, informing accurate site selection.
Weibull parameters A and k for wind distribution modeling
Helps predict energy production potential by modeling wind speed variations over time.
Mean power density and air density for turbine suitability analysis
Evaluates the energy available in the wind at a specific location, guiding turbine selection and placement.
Global reanalysis data for long-term wind assessments
Accurately forecast with long-term wind datasets spanning 10-35+ years from industry-leading reanalysis models.
Formats available: CSV, JSON
MERRA-2 (NASA): 50 m resolution, 1-hour intervals
High-resolution atmospheric reanalysis data, useful for validating long-term wind trends.
ERA5 (ECMWF): 30k m resolution, 1-hour intervals
Provides detailed weather and climate information, including wind speeds, air pressure, and temperature.
CFSR (NOAA): 55 km resolution, 6-hour intervals
Ideal for historical wind pattern analysis and large-scale energy modeling projects.
Typical Year Met MastTY-VMM for pre-development analysis
Generate a full-year synthetic wind dataset based on long-term climate models.
Formats available: CSV, JSON
Hourly wind speed, direction and shear profile data
Provides a highly detailed breakdown on wind conditions, helping refine energy yield estimates for proposed wind farms.
Diurnal and seasonal wind variability for energy forecasting
Helps developers understand how wind speed fluctuations impact annual energy production.
Custom hub heights for turbine-specific analysis
Offers wind projections at multiple heights, assisting in your turbine selection and placement.
GIS-ready wind maps for spatial analysis
Seamlessly integrate high-resolution wind resource data in Geographic Information System (GIS) and wind energy software for site planning and analysis.
Formats available: GeoTiff, shapefile, KMZ
High-resolution raster data
- Annual average wind speed maps (GeoTIFF, 200 m resolution) – High-resolution raster files provide detailed wind resource visualization for GIS-based site selection.
- Digital elevation models (DEM) – Elevation and terrain data help assess how wind interacts with natural features like hills, values and ridges.
- Surface roughness maps – Classifies terrain features such as forests, water bodies and urban areas to refine wind flow modeling and turbulence intensity calculations.
Vector data for advanced analysis
- Wind distribution data (shapefile format) – Weibull parameters, power density, and frequency distribution allow developers to analyze site-specific wind trends and energy potential.
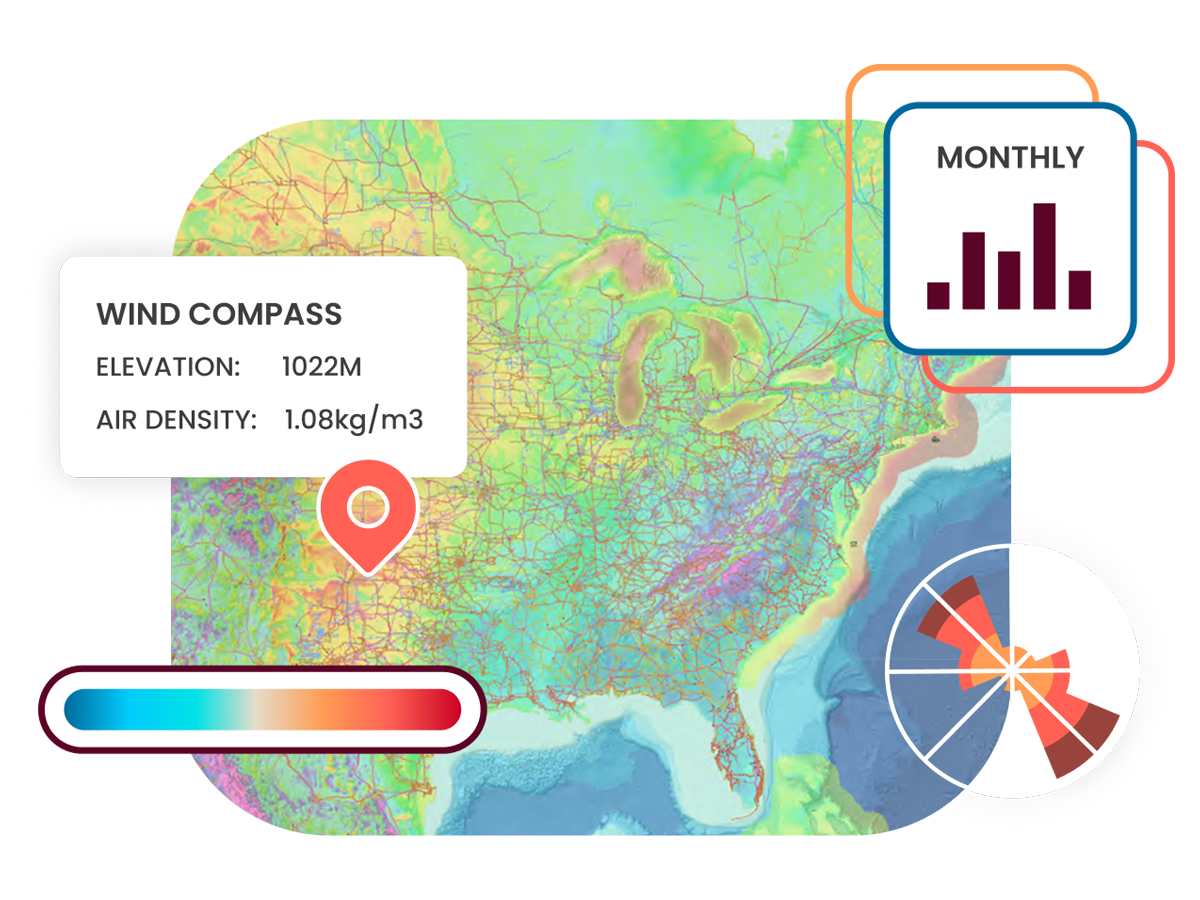
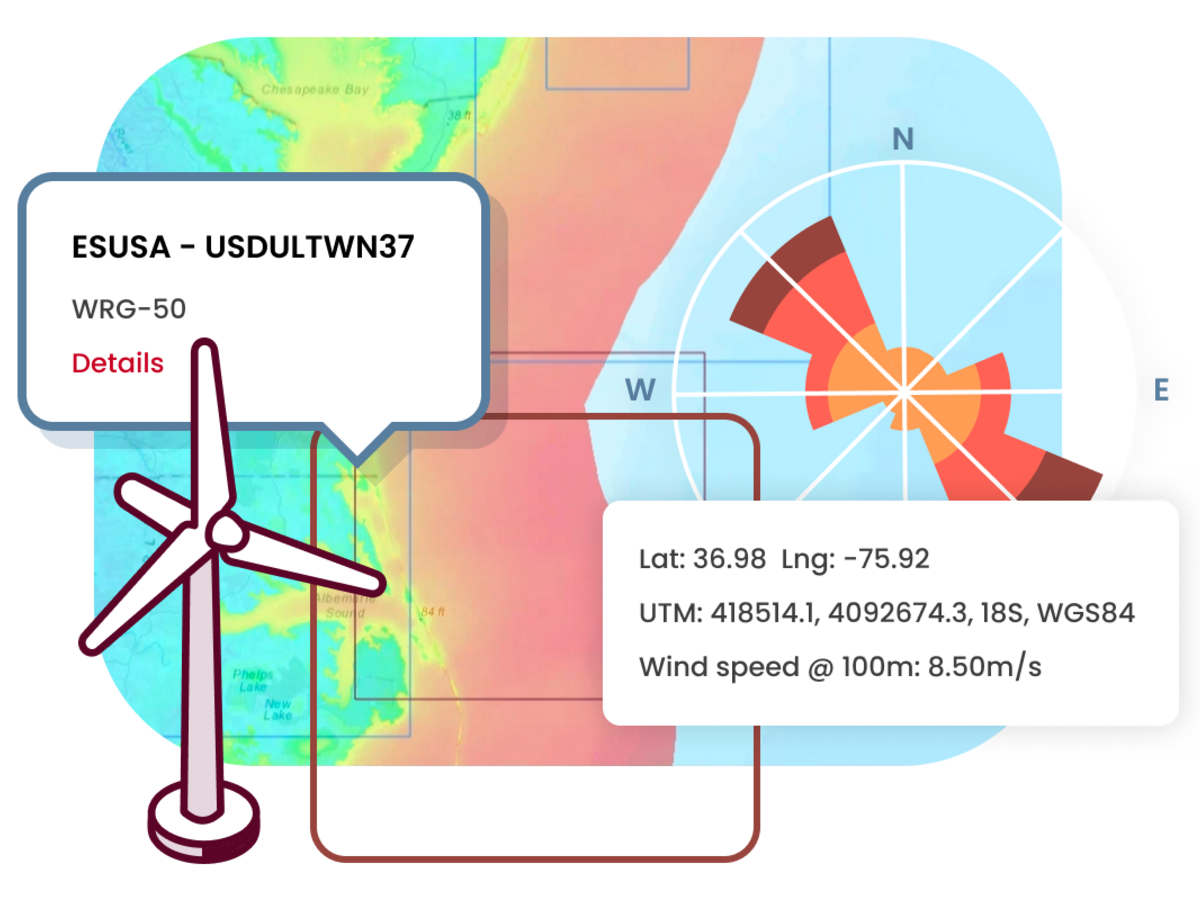
- Wind rose data (16-directional frequency analysis) – Provides a graphical representation of wind speed and directional consistency at a given site
- Monthly and diurnal wind variability data – Helps developers plan for seasonal and hourly fluctuations in wind speed, improving financial modeling and grid integration strategies.
Google Earth (KML) files
- Interactive wind maps with user-defined hub height overlays – Enables developers to visualize wind resources at different hub heights for turbine placement optimization.
- Overlay additional project data for enhanced wind farm planning – Combine wind maps with transmission line data, land use classifications and other geospatial layers for better planning.
Seamless integration with wind energy software
Direct integration with Wind Developer Suite
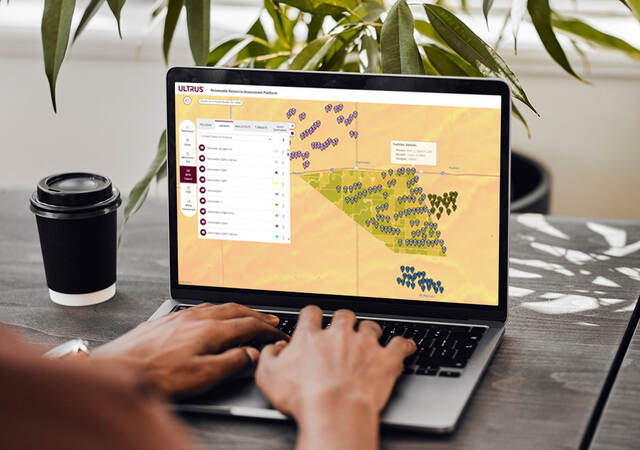
- ULTRUS™ Renewable Resource Assessment Platform (RRAP) Project Prospecting – Import WRG data for preliminary site assessments
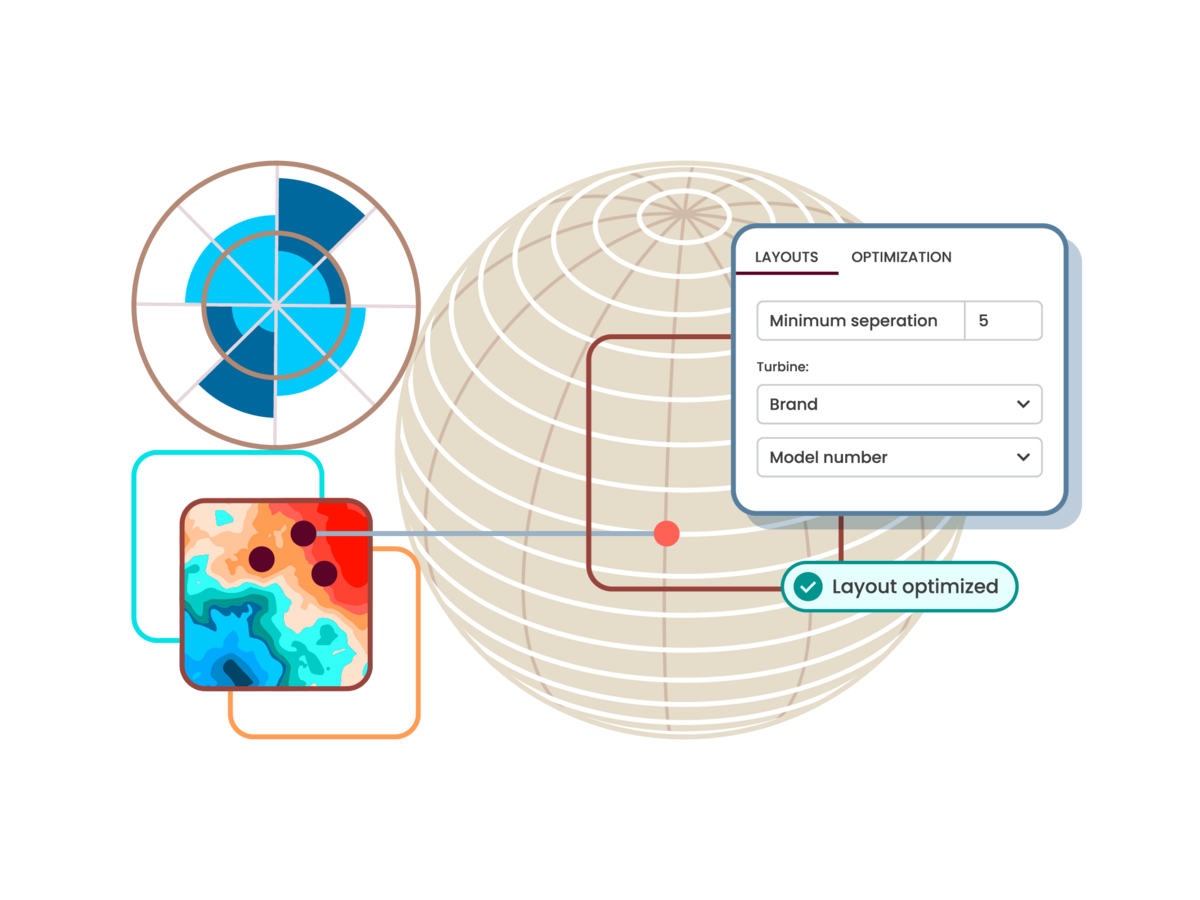
- OpenWind Farm Design – Optimize turbine placement using high-resolution wind maps
- Operational Monitoring Tools – Compare actual vs. predicted wind conditions for performance analysis.
Export data to leading GIS and wind energy tools
- Windographer – Import time series data for Measure-Correlate-Predict (MCP) analysis
- Openwind – Directly access WRG datasets for wake modeling and layout optimization
- GIS platforms (ArcGIS, QGIS, Google Earth) – Seamless wind data visualization
Windnavigator: A core part of the ULTRUS™ Wind Developer Suite
Windnavigator is one of the essential tools within the ULTRUS™ Wind Developer Suite, a fully integrated software platform designed to support developers, engineers and asset managers through every stage of wind energy life cycle.
Why wind developers choose ULTRUS™ Windnavigator

Access the most accurate wind resource data available
Windnavigator’s datasets are validated against thousands of met mast measurements, providing high-precision wind estimates at any location.
On-demand wind data can help you save time and costs
No waiting for custom data requests — access global reanalysis datasets, WRGs and time series data instantly.
Calculate bankable energy yield estimates
High-resolution wind data improves turbine siting, wake modeling and financial forecasting, empowering data-driven investment decisions.
Frequently asked questions
- What is Windnavigator, and how does it support wind energy development?
Windnavigator is a wind resource data platform that provides high-resolution wind maps, historical climate datasets, and GIS-ready wind data for site selection and feasibility studies. It enables wind developers to assess wind energy potential with accuracy and confidence before making investment decisions.
- What is mesoscale modeling, and why is it important for wind assessments?
Mesoscale modeling simulates atmospheric conditions at a regional scale (1-100 km resolution). It captures wind behavior over large areas and accounts for synoptic weather patterns, making it essential for long-term wind resource assessments and climate modeling.
- What is microscale modeling, and how does it refine wind predictions?
Microscale modeling focuses on localized wind flow (less than 1 km resolution), capturing fine-scale effects such as terrain roughness, vegetation and buildings. It improves wind speed accuracy at specific turbine locations, reducing uncertainty in energy yield estimates.
- What is a Wind Resource Grid (WRG), and how is it used?
A WRG is a dataset that provides wind speed, Weibull parameters and power density at various hub heights. Developers use WRGs for early-stage site assessments, met tower siting and wind farm design validation.
- How does ULTRUS Windnavigator improve wind prospecting?
Windnavigator delivers 200 m-resolution wind maps, long-term reanalysis datasets (MERRA-2, ERA5, WRF), and GIS-compatible export formats for easy integration into wind modeling software.
- What is the Weibull distribution, and why is it important?
The Weibull distribution is a statistical model that describes wind speed variability at a given location. The two parameters, Weibull A (scale) and Weibull k (shape), help predict energy production potential and turbine efficiency.
- Can I export wind resource data for use in GIS and wind modeling software?
Yes, Windnavigator supports export formats such as GeoTIFF, shapefile (.shp), Google Earth (KMZ), CSV and JSON, making it easy to use in GIS platforms and energy modeling software.
Windnavigator Resource Data and Maps and ULTRUS™ software
Windnavigator Resource Data and Maps is now part of ULTRUS software, which brings together flagship digital offerings from UL Solutions to help customers meet their regulatory, supply chain and sustainability challenges.
Ready to optimize your data collection and analysis capabilities for wind energy prospecting?
Schedule a demo with a UL Solutions software expert today.
